DASHBOARD STUDIESPORTFOLIO COLLECTION / 2026

Data / BI portfolio · 5 case studies

Data.
Clarity.
Decisions.

From business questions to verifiable findings.
Five projects covering data preparation, sales workflows and interactive dashboards. Inspect the data, formulas and code behind the results.

Working demos · synthetic data

Портфоліо в дії / 40 секунд

Подивіться, як працюють дашборди

Короткий огляд трьох реальних демо: продажі інтернет-магазину, SaaS-аналітика та операційні сценарії. Відкрийте кейси нижче, щоб самостійно перевірити показники, фільтри та розрахунки.

3 дашбордиБез звукуСинтетичні дані
05 / PROJECTS
Commerce overview: interactive metrics and charts
01 / Foundational

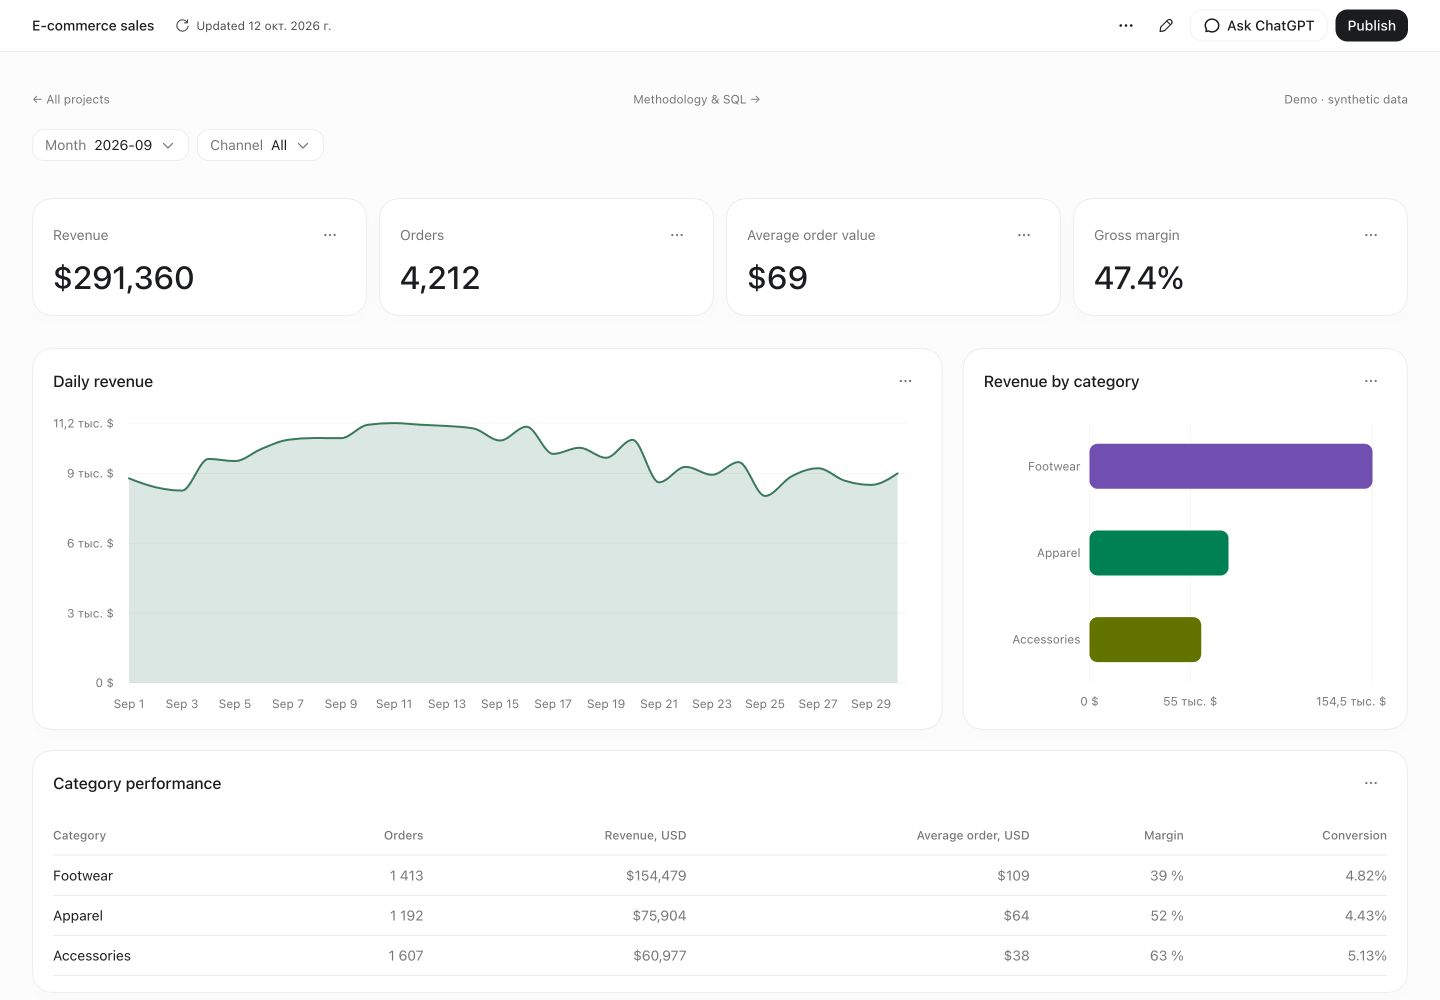
Commerce overview

How do sales change, and which categories generate revenue and gross profit?

Star schemaKPISQL · LAGGross margin
Explore dashboardRead case study & SQL
Scope and approach

Revenue, orders, average order value and gross margin. Month and channel filters update all metrics together. The case compares month length, category contribution and profitability. Apr–Sep 2026 · 1,647 rows.
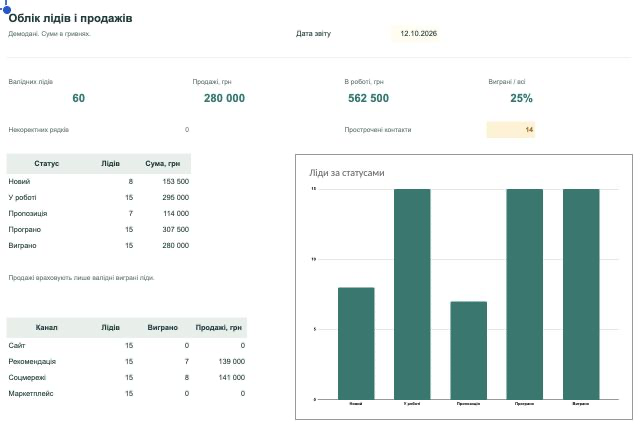
Lead & sales workspace: actual report preview
02 / Intermediate

Lead & sales workspace

How can a small team track leads, follow-ups and won sales in Google Sheets?

Google SheetsApps ScriptCSV upsertSales workflow
View workflow & files
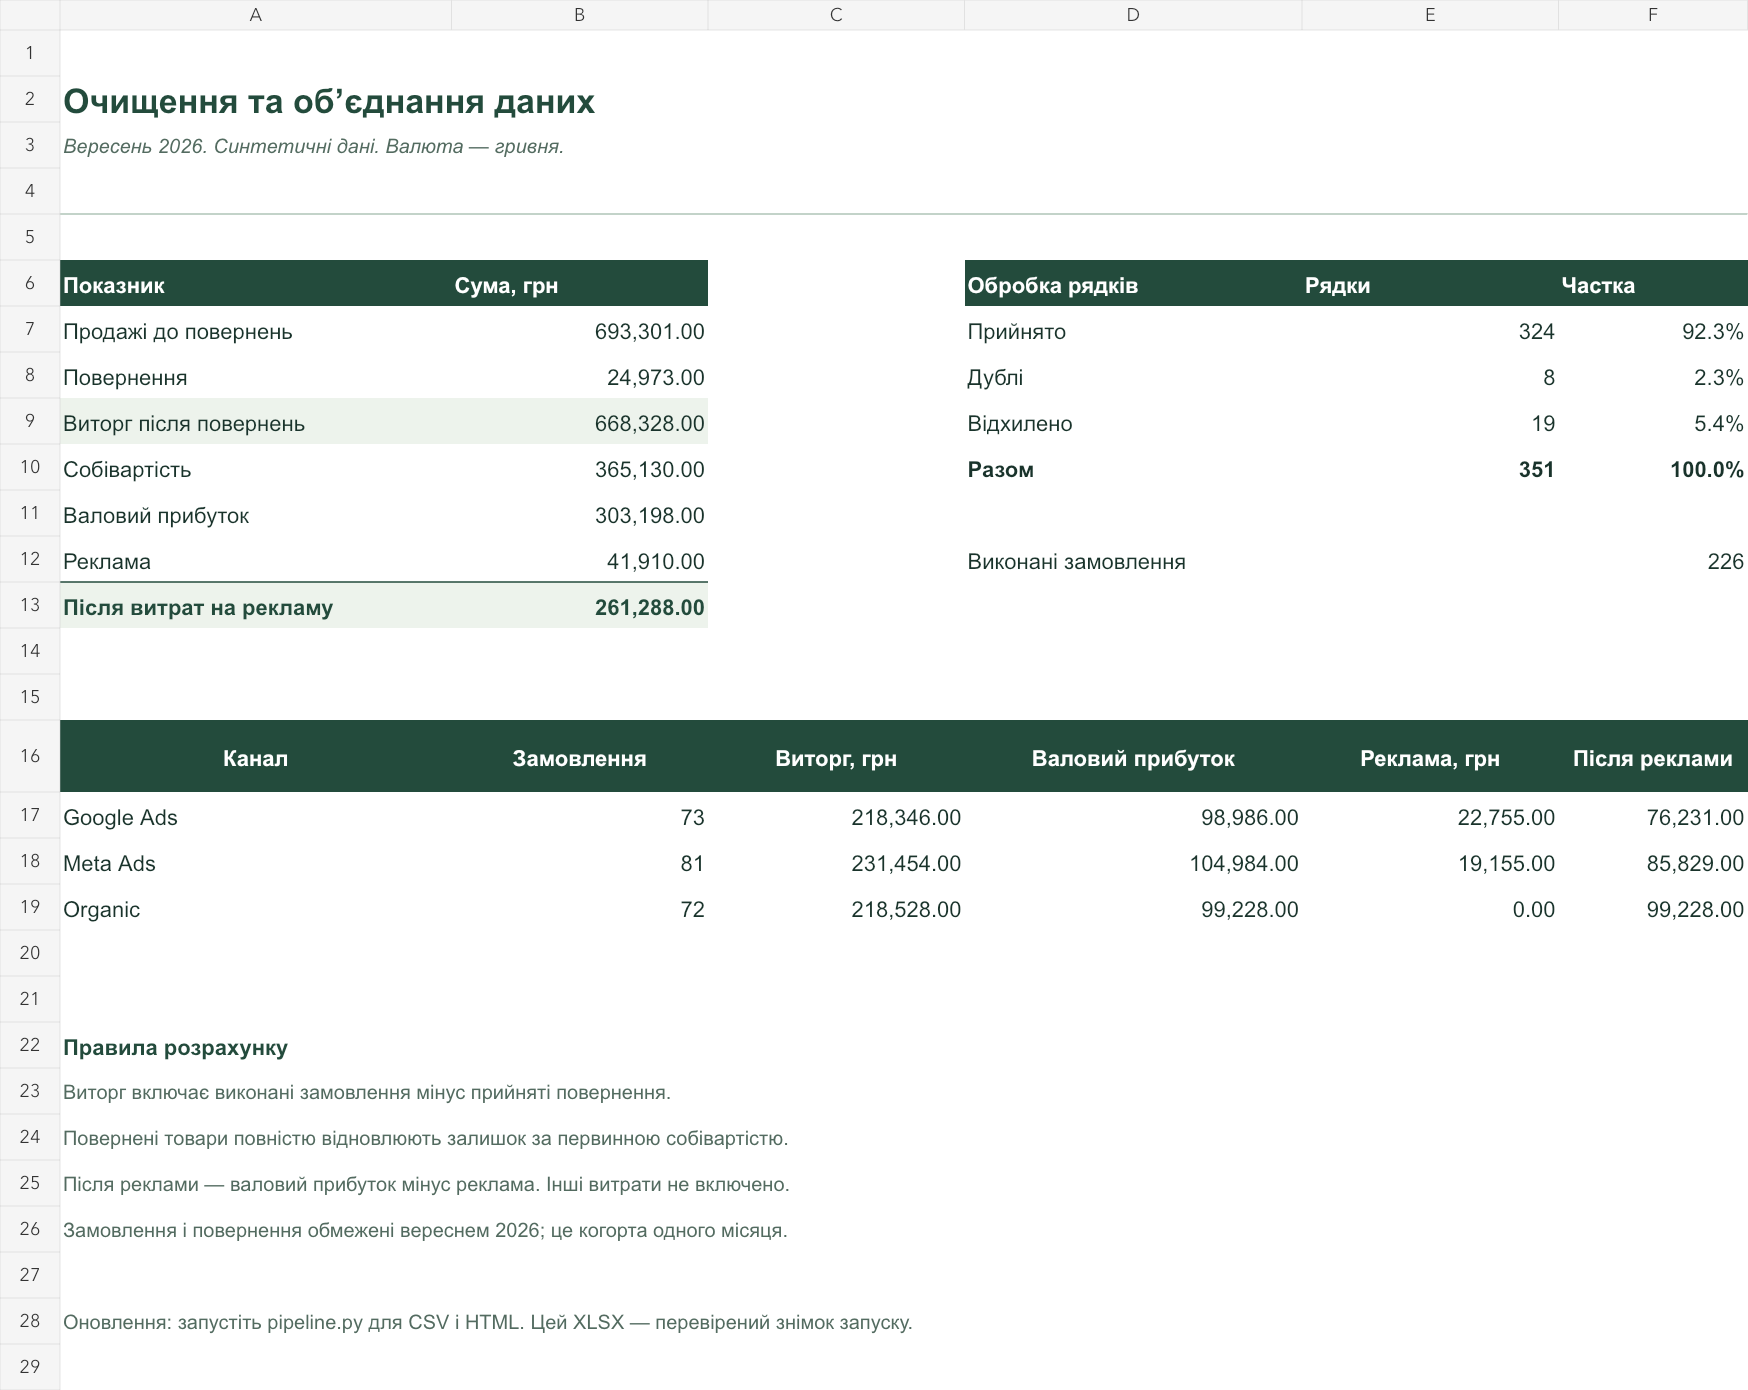
Data cleaning pipeline: actual report preview
03 / Intermediate

Data cleaning pipeline

How do inconsistent CSV exports become a traceable, reconciled report?

PythonCSV → XLSXValidationRow-level audit
View workflow & files
Product analytics: interactive metrics and charts
04 / Intermediate

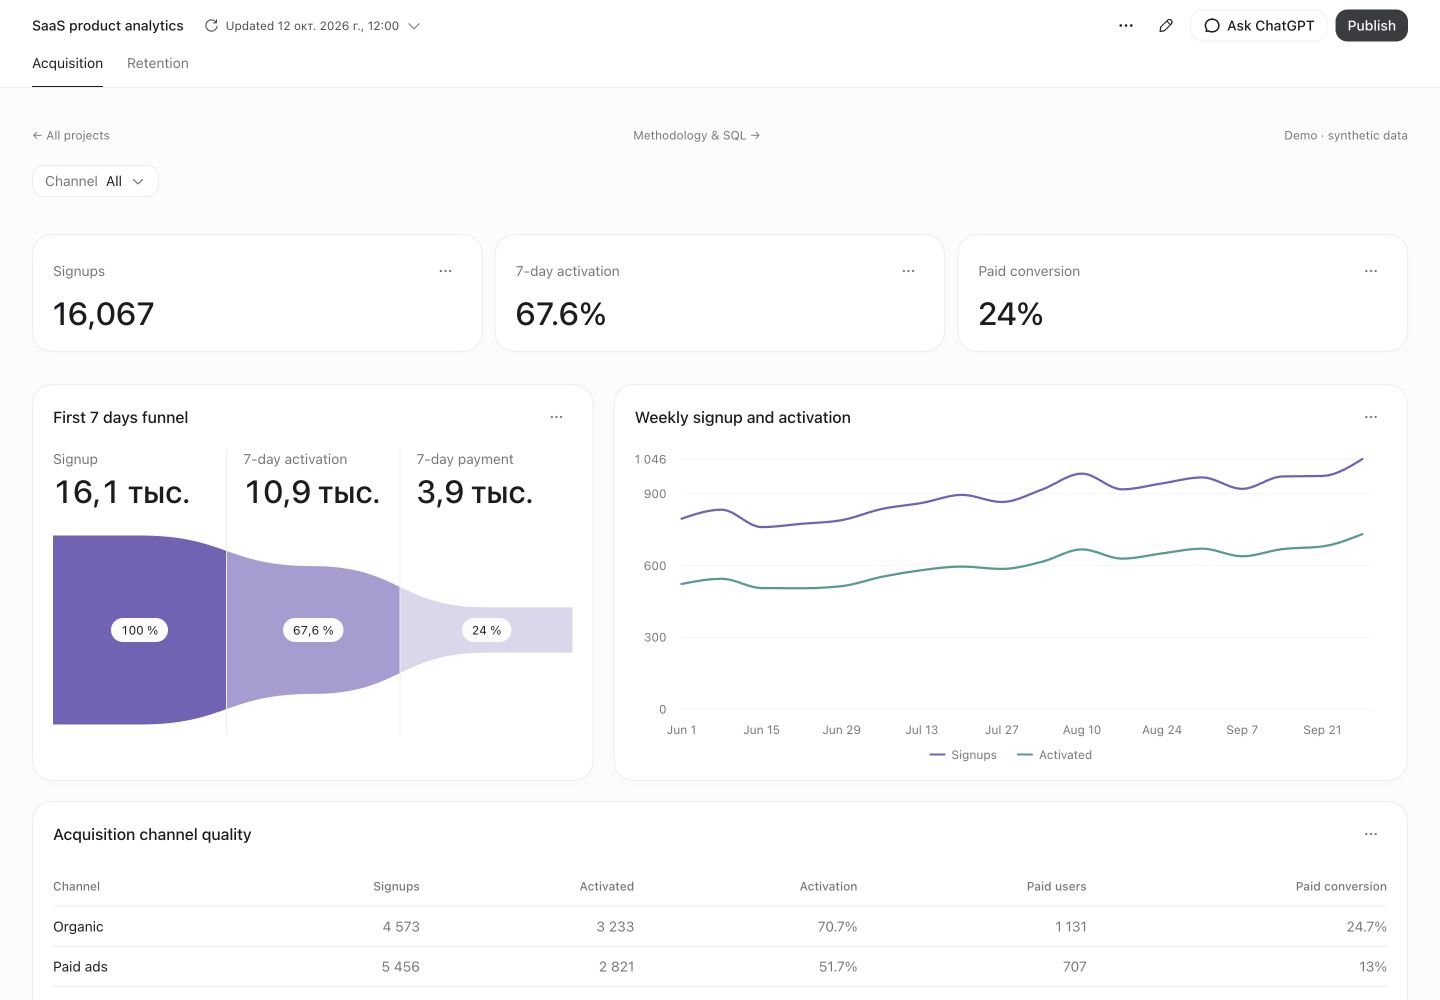
Product analytics

How do users reach activation and payment, and which cohorts return in week 4?

FunnelCohortsRetentionMaturity rules
Explore dashboardRead case study & SQL
Scope and approach

Separate acquisition and retention views, a first-7-day funnel, W0–W8 retention and cohort drill-down. Unobserved weeks stay blank. 18 signup cohorts · 3 channels · 486 rows.

Operations control: interactive metrics and charts
05 / Advanced

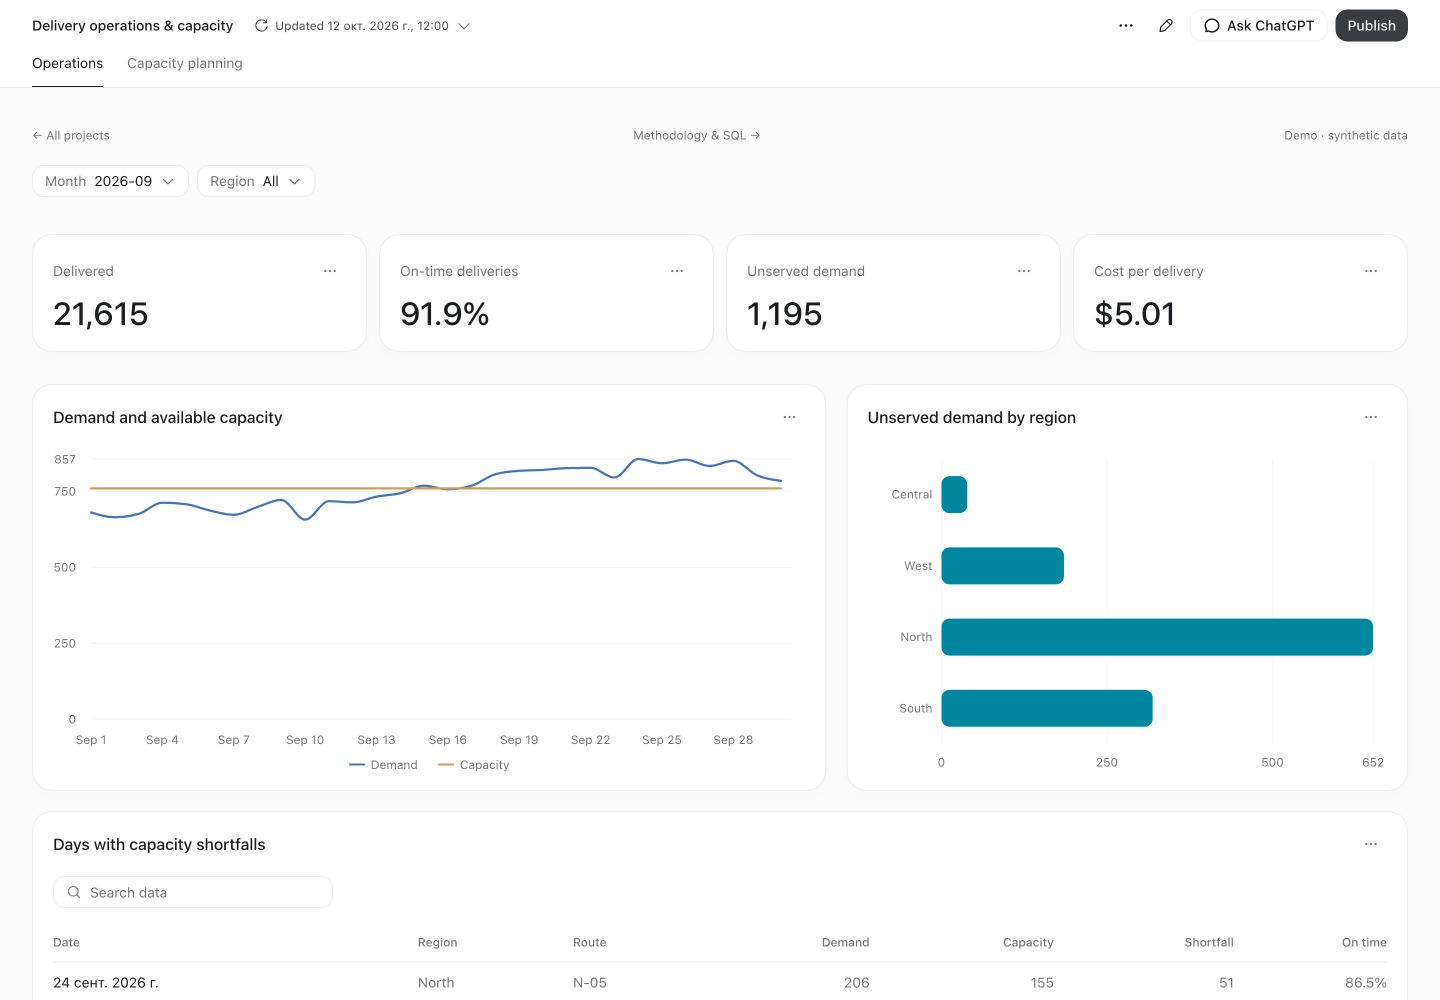
Operations control

Where does capacity fall short, and what changes when demand or capacity grows?

ExceptionsSQLWhat-ifCost model
Explore dashboardRead case study & SQL
Scope and approach

A queue of daily capacity shortfalls, route detail and region filters. A scenario calculator uses explicit daily capacity costs. Jul–Sep 2026 · 364 rows. Sensitivity analysis, not a forecast.

From metrics to action

More depth.
The same clarity.

01 / MONITORUnderstand performance

Consistent KPIs, trends and category contribution.

02 / EXPLOREInvestigate differences

Channels, funnels, eligible cohorts and useful drill-downs.

03 / MODELCompare a scenario

Explicit assumptions, recalculation and a fair comparison.

Explore the three dashboard case studies

Source data, SQLite, SQL and 24 validation checks for the three dashboards.
The cleaning and lead-tracking cases include their own files and verification.

Download data & SQL ↓